Measuring the success of your support efforts is critical. Metrics help you understand your customers' experience, give you insight into weak spots of your operation, and help you track whether the changes you make are improving things.
In Kayako's Insights area, you have access to a wealth of built-in charts and metrics so you can quickly look in on how your support efforts are going. In addition, you can build and run your own custom reports, so you can answer any questions you have about your support interactions.
In this article we'll give you a quick overview of Kayako's analytics and reporting features in the Insights area. We'll also link to more in-depth resources to help you interpret your team's data.
Getting to know the Insights area
From anywhere in the agent or admin areas, you can access Insights by clicking the chart button on the right-hand sidebar.
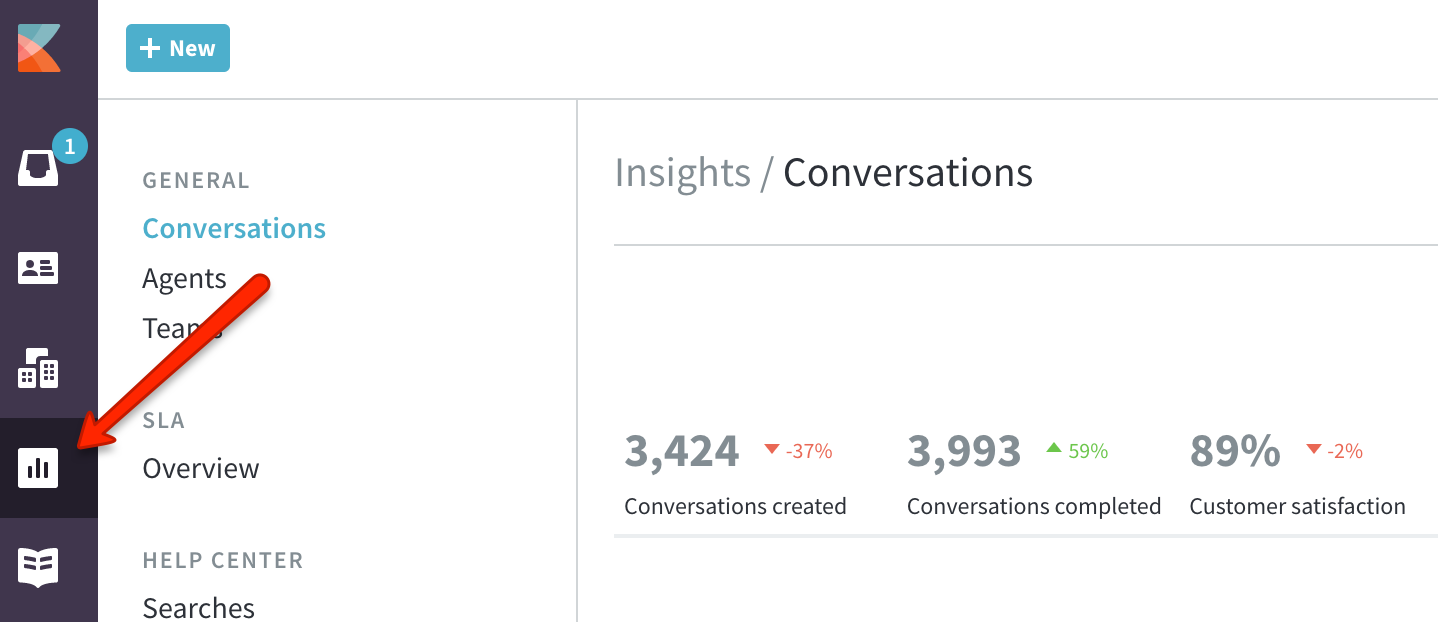
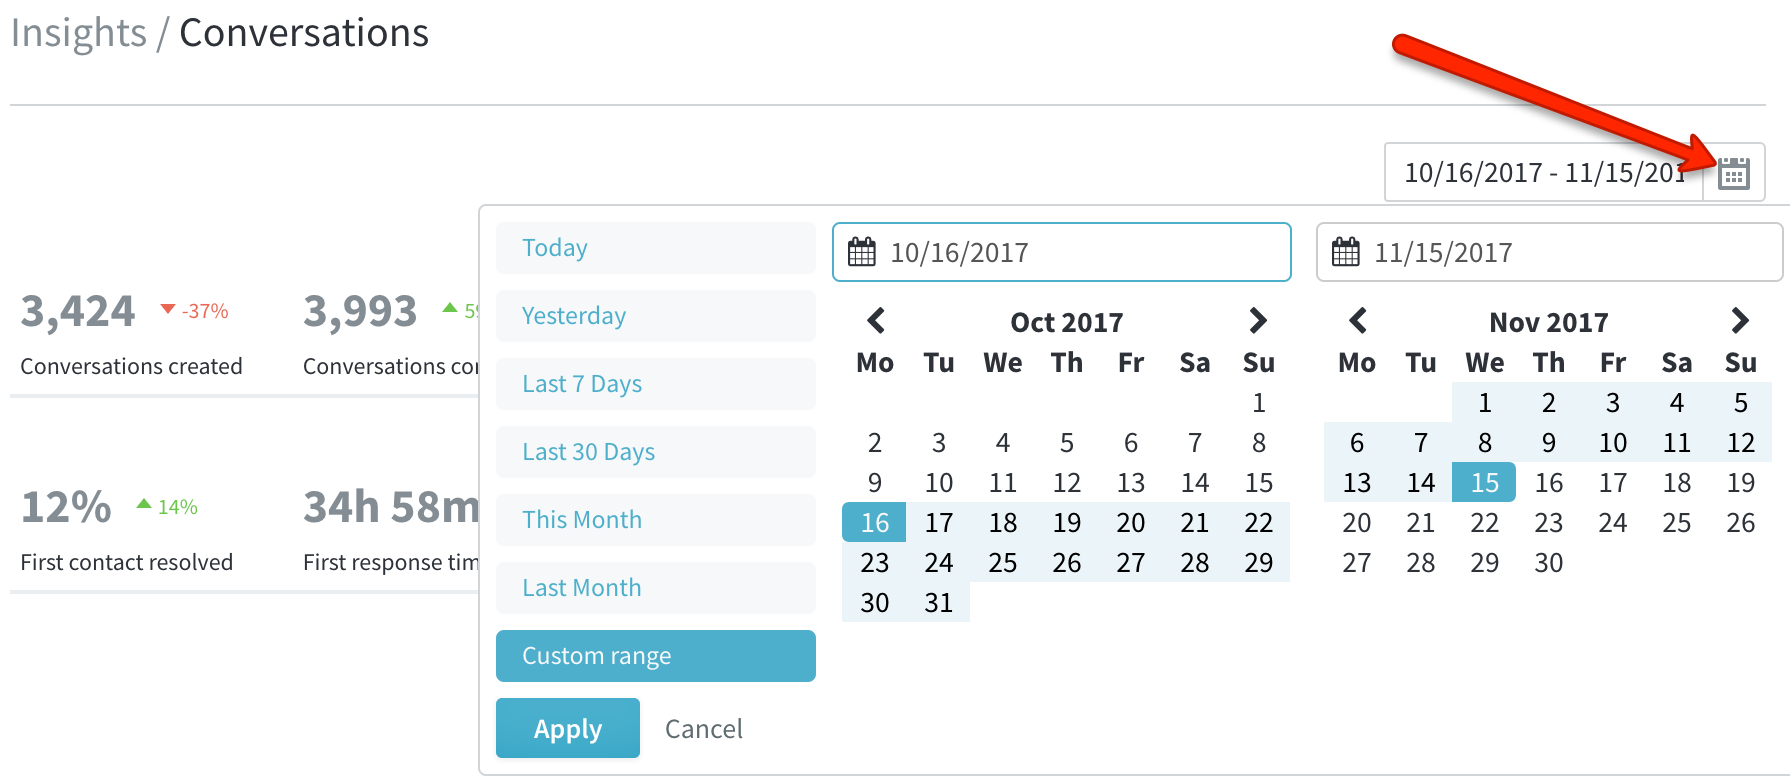
On the majority of the Insights pages, you'll see a mix of metrics, graphs, and tables. In addition, most of them have the option to set a timeframe to restrict the data you're seeing.
In the upper right-hand corner of the page, the calendar icon will let you choose or define a timeframe:
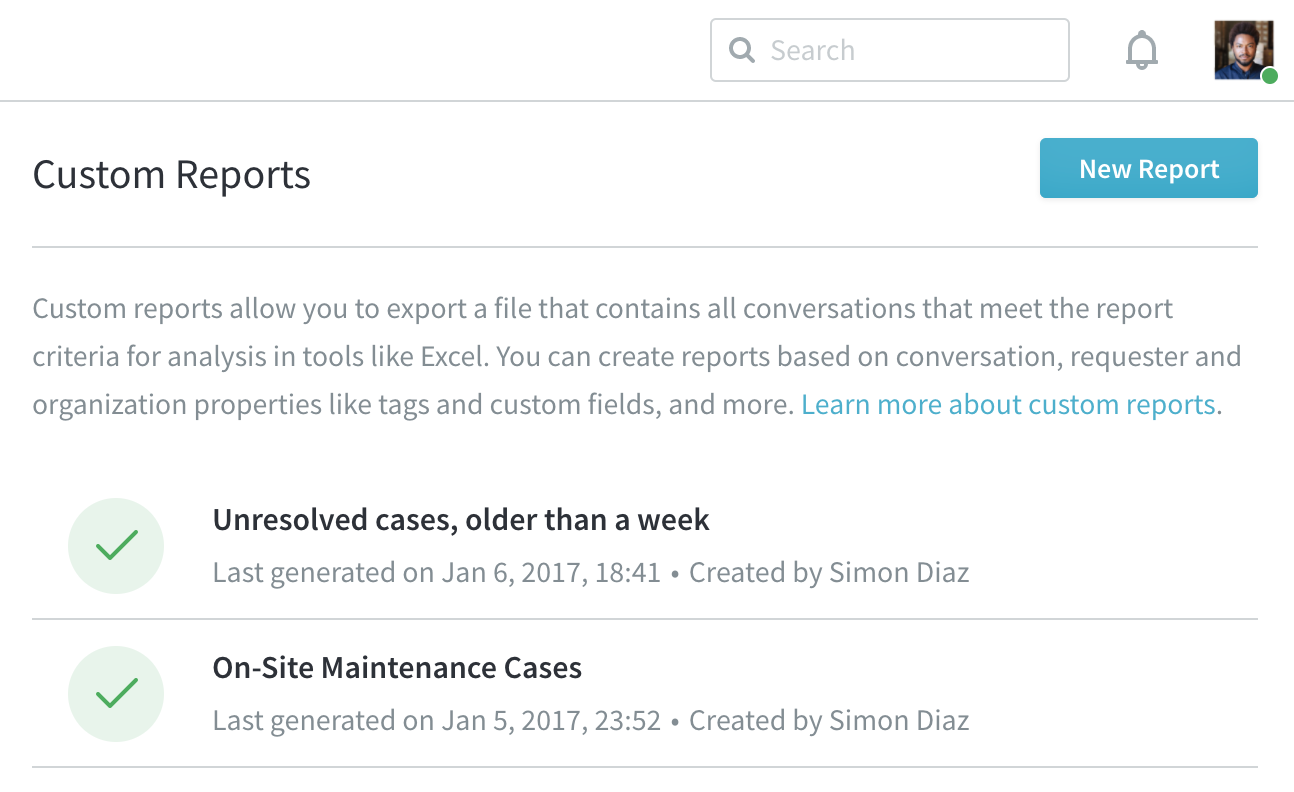
The last page in the section, 'Custom Reports' is where you'll build and run your own reports, so you can answer any questions that aren't answered with default metrics.
Using the links in the sidebar, you can peruse all of your different metrics and reporting options, which we'll summarize here:
-
The 'General' section has three pages – one each for your conversation, agent, and team metrics. You'll find things like completion rates, response times, and CSAT scores for your entire support organization, specific teams, or individual agents.
Learn more in our article about performance metrics.
-
The 'SLA' section shows you how well you're doing when it comes to meeting your benchmarks for a particular SLA plan. You can also look at how well you've been at meeting your SLA targets, over time.
Learn more in our article about SLA metrics.
-
The 'Help Center' section includes data about common – as well as failed – searches on your Help Center. You'll also find a listing of your most popular Help Center articles.
Learn more in our article about self-service metrics.
-
Finally, in the 'Reporting' section you can define and run your own custom reports. Each report creates a .csv file with a huge amount of detailed data on your support conversations.
Learn more in our article about building custom reports.
Kelly O'Brien