Identifying weak spots in your support team's performance is key to improving the service they provide. It's much easier to make change for the better when you know how long it's taking them to resolve a conversation, or how your customers feel about the service they're getting.
This article will explain how to interpret the metrics included in the 'General' section of Kayako's Insights pages. Below, we'll go through the definitions for each metric on the 'Conversations', 'Agents', and 'Teams' pages.
NOTE: For more help with Insights or reporting, have a look at our intro article, or our articles on SLA metrics, Help Center metrics, or building custom reports.
General insights for conversations, agents, and teams
The first three Insights pages fall under the 'General' heading. Here, you can hone in on areas of improvement through key metrics on your conversations, individual agents, and teams. You can analyze team performance and gain new perspective by viewing insights over different time periods.
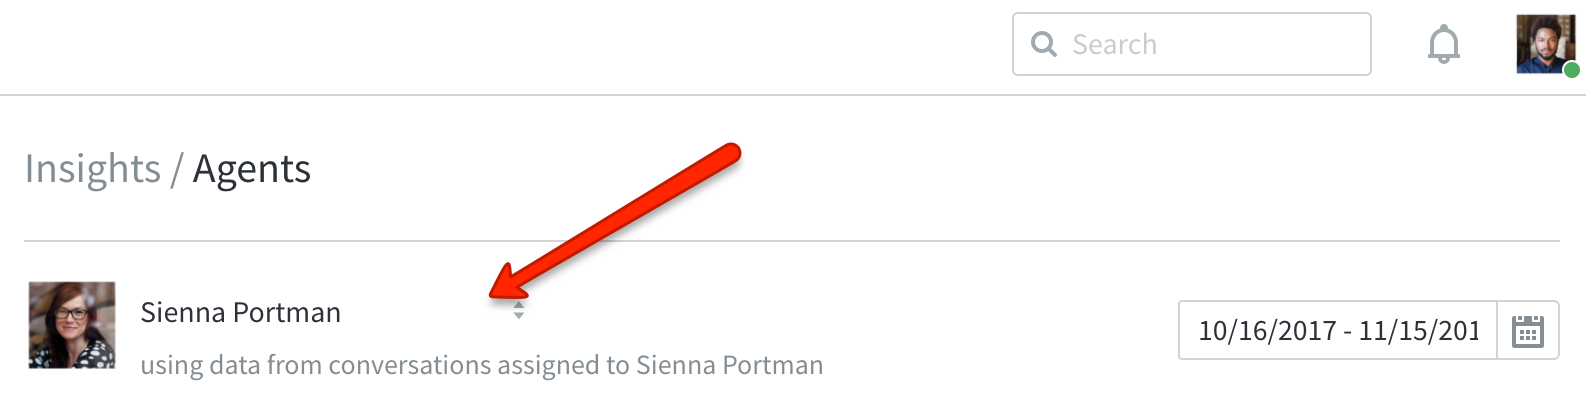
Each page in this section includes the same set of metrics, but on the 'Agents' and 'Teams' pages, you'll be able to see those statistics just for the conversations assigned to the agent or team you specify.
The reference table below shows the key metrics provided for conversations, agents, and teams.
| METRIC |
DESCRIPTION |
|---|---|
| Conversations created |
The number of conversations that were created (started). |
| Conversations completed |
The number of conversations that were completed. |
| Customer satisfaction |
The CSAT score calculated from completed conversations within the period. |
| Customers helped |
The number of unique customers communicated with (even if agent or team worked on multiple conversations from the same customer). |
| Response time |
The average response time (the time between each requester reply and the next agent reply) of conversations that were completed within the period. |
| Resolution time |
The average amount of time it took to complete conversations within the period. |
| First contact resolved |
The percentage of conversations that were completed within the period after just one reply. |
| First response time |
The average first response time of conversations completed within the period. |
| Replies to resolution |
The average number of replies exchanged in conversations that were completed within the period. |
| First assignment time |
The average amount of time it took to assign conversations that were assigned for the first time within the period. |
| Team changes |
The average number of assigned team changes for conversations assigned within the period. |
| Total assigned* |
The number of conversations that were assigned to this agent or team (and are still assigned) within the period. |
| Conversations touched* |
The number of conversations that this agent or team updated in some way. |
| Total public replies* |
The total number of public replies (this excludes private notes). |
*These metrics are only available on the 'Agents' and 'Teams' pages.
Visualizations of your conversation, agent, and team data
Below your key metrics are visual overviews of your team's core insights over a day, week, or month.
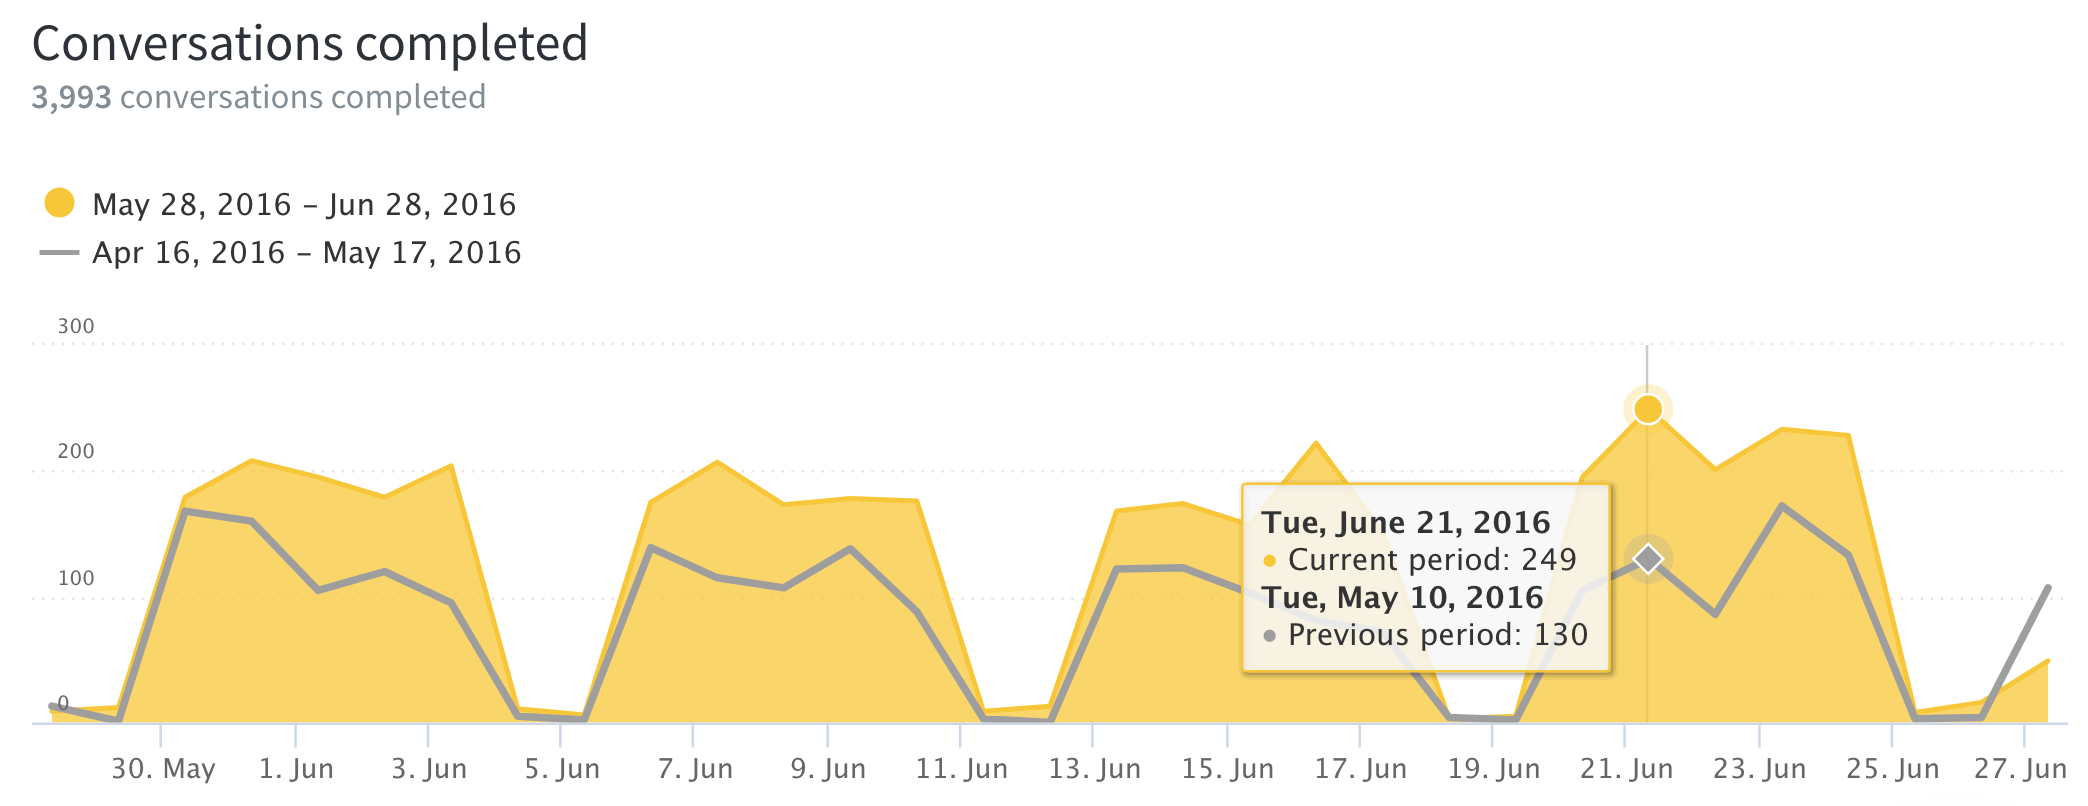
On each graph you'll see the current period's data (yellow) compared to the same data from the previous period (gray). The table below lists the kinds of graphs found in this section and their description.
| METRIC |
DESCRIPTION |
|---|---|
| Conversations completed |
The number of conversations that were completed during the selected timeframe. |
| Average response time** |
The average response time (time between each customer message and the next agent reply) of conversations that were completed within the period. |
| Average resolution time** | The average amount of time it took to complete conversations within the period. |
| Messages received** |
The total number of posts received within the period. Click on the options below the graph to toggle channels. |
| Customer satisfaction score* |
The CSAT score calculated from completed conversations assigned to the agent or team within the period. |
* These metrics are only available on the 'Agents' and 'Teams' pages.
** These metrics are only available on the 'Conversation' page.
Agent and team SLA performance metrics
On the 'Agents' and 'Teams' pages, you'll see an extra two graphs at the bottom of the page. These display data on your agent's or team's overall and specific SLA target performance.
To view your agent or team metrics for a specific SLA plan, select the plan from the dropdown. The percentage indicators beside each metric determine if you hit (green) or missed (red) the target SLA performance for that plan over a period of time.
SLA performance is measured using three benchmarks:
- First reply time — The time between when the conversation is created and when your support staff sends their first reply.
- Next reply time — The time between when the customer updates the conversation and your support staff sends their response. This will reset every time your staff updates the conversation.
- Resolution time — The time between when the conversation was created and when it's set to 'Completed'.
The reference table below shows a breakdown of each of your target performance metrics for each SLA plan.
| METRIC |
DESCRIPTION |
|---|---|
| Percentage target achieved |
The target achievement rate for conversations where this agent or team was the assignee. |
| Target breaches |
The total number of target misses for conversations where this agent or team was the assignee. |
| Time to target |
The average amount of time it took to meet the target for conversations where this agent or team was the assignee. |
| Breaches overdue by |
The average amount of time over a target, for conversations which missed their target while the agent or team was assigned. |
Stephanie Gonzaga