Service level agreements (SLAs) help your support team respond to and resolve issues in a timely manner. From the Insights area, you can monitor how well your team is meeting your SLA plan targets over a period of time.
In this article, we'll explain how to interpret the metrics included in the 'SLA' section of Kayako's Insights pages. Below, we've put together a reference table that lists and explains the key metrics used to track and monitor your SLA target performance.
NOTE: For more help with Insights or reporting, have a look at our intro article, or our articles on performance metrics, Help Center metrics, or building custom reports.
SLA target performance metrics
SLA performance metrics are based on three benchmarks:
- First reply time – The time between when the conversation is created and when your support staff sends their first reply.
- Next reply time – The time between when the customer updates the conversation and your support staff sends their response. This will reset every time your staff updates the conversation.
- Resolution time – The time between when the conversation was created and when it's set to 'Completed'.
Each benchmark corresponds to a set of metrics that determine if your teams are meeting the target response and resolution times. The percentage indicators beside each metric determine whether you hit (green) or missed (red) the target performance for that SLA plan over a period of time.
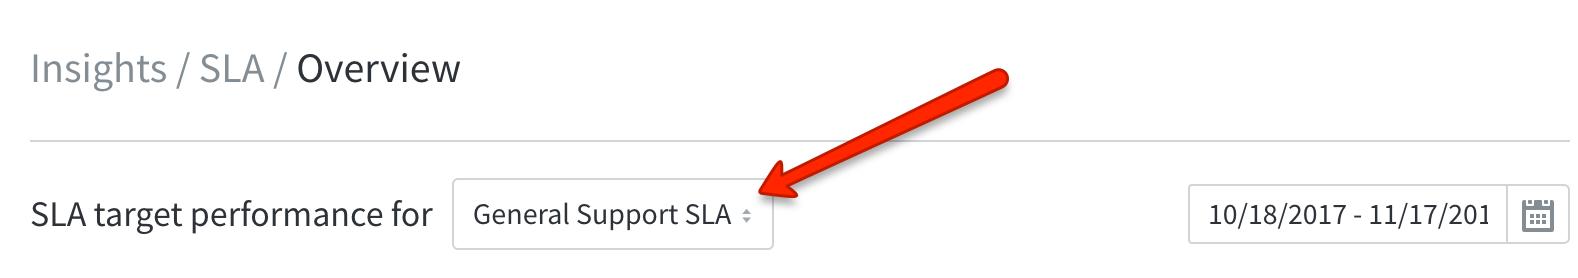
If your team uses multiple SLA plans, you can select which plan's data you want to see from the plan selection dropdown:
The core metrics for your SLA target performance are:
| METRIC |
DESCRIPTION |
|---|---|
| Percentage target achieved |
The total target achievement rate based on your target response and resolution goals |
| Target breaches |
The total number of times you missed your target goals |
| Time to target |
The average amount of time it took to meet your target goals |
| Breaches overdue by |
The average amount of time conversations were overdue, when their target goals were missed |
Visualizations of your SLA target performance metrics
Below your core metrics table is a visual overview of your SLA target performance over a period of time.
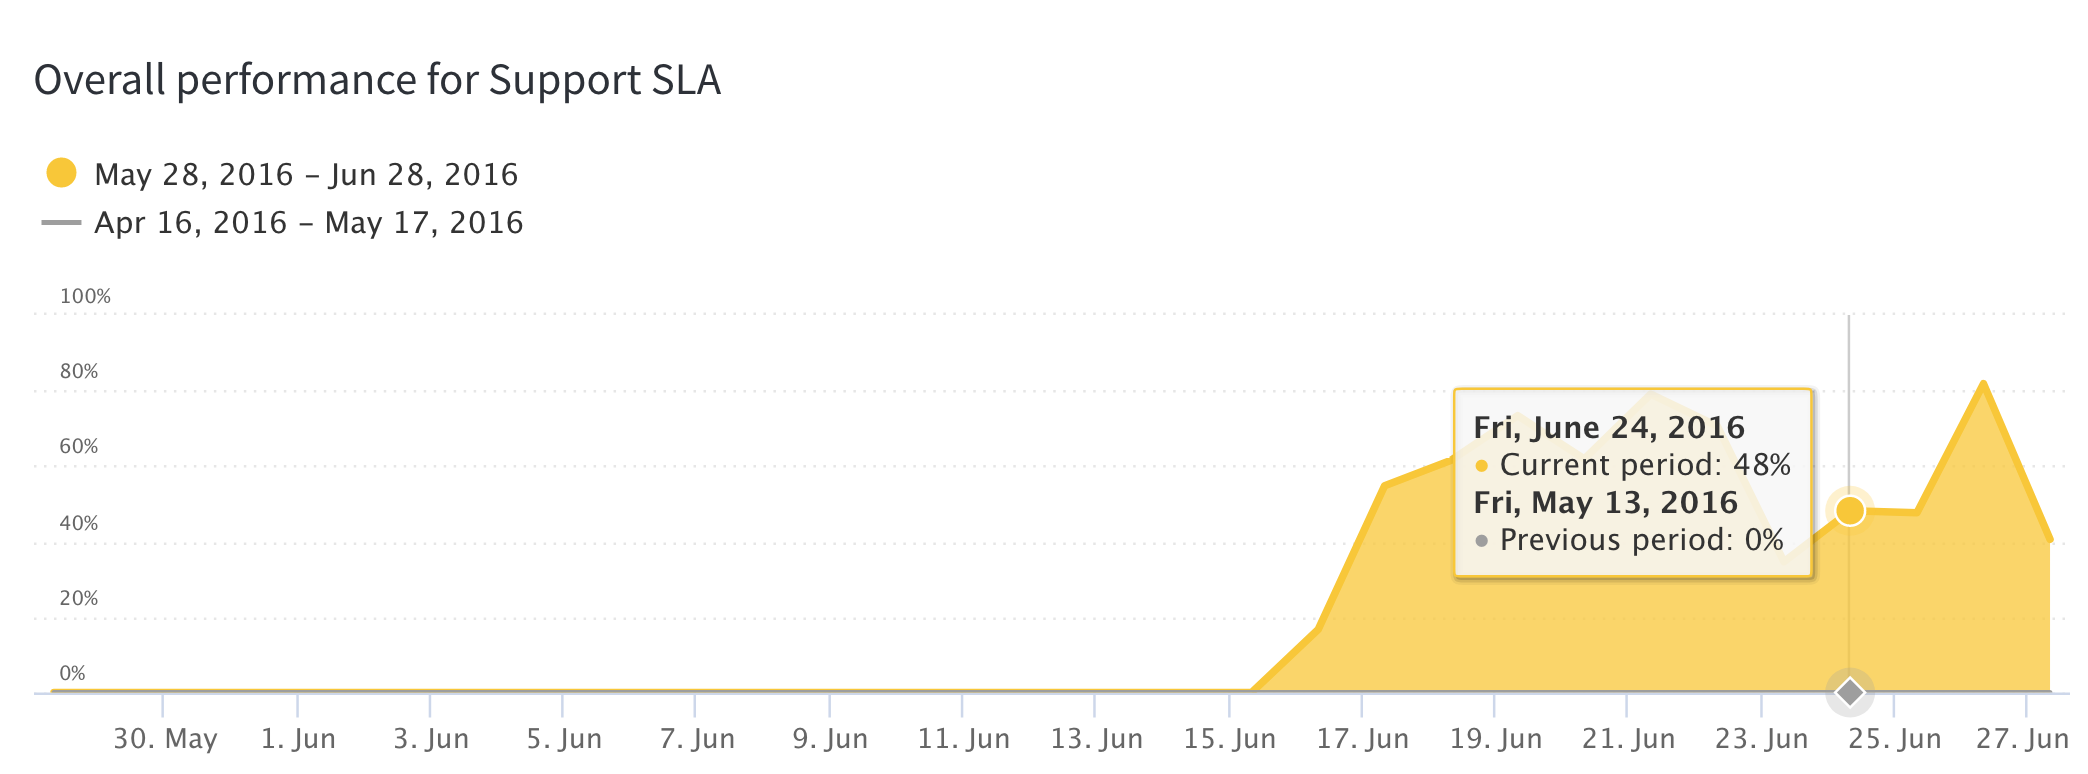
You can toggle to view your SLA insights per day, per week, or per month. Kayako displays your current overall performance insights (yellow) against that of the previous period (gray).
Stephanie Gonzaga